When developing a standard application it’s easy to just debug it step-by-step. But, when developing a library (DLL file), we need to do additional steps.
In this case I’m using Visual Studio 2005 and developing a library that will be used by IIS 7 in Windows Server 2008 environment.
Step 1:
Run remote debugger wizard from “Start -> All Programs -> Microsoft Visual Studio 2005 -> Visual Studio Tools -> Visual Studio 2005 Remote Debugger Configuration Wizard”
The purpose of this step is to open ports in Windows Firewall for Visual Studio to do debugging.


Step 2:
Run the remote debugger based on the processor the library is built. In this example the library is built using x86 processor. Run the program from “Start -> All Programs -> Microsoft Visual Studio 2005 -> Visual Studio Tools -> Visual Studio 2005 Remote Debugger”.
Up to this step the remote debugger is already up.


Step 3:
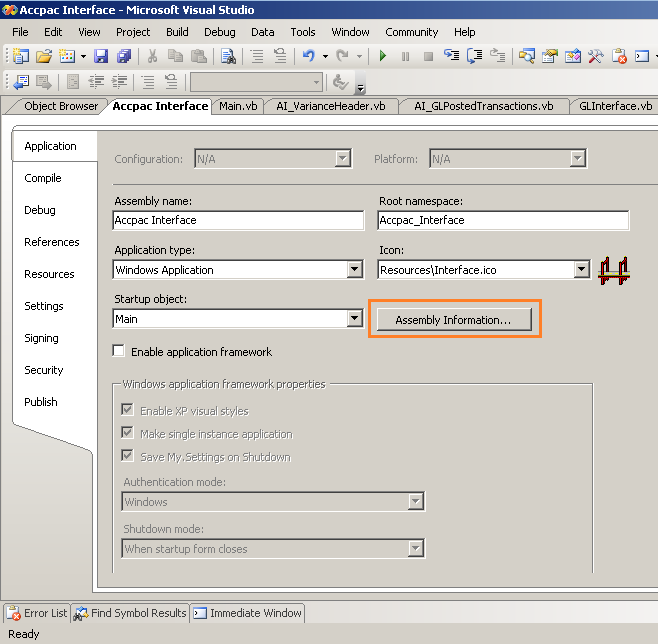
Make sure the output of the library is the location where the library will be called by the IIS.

Step 4:
Attach the process to IIS process in “Tools -> Attach to Process …”, select to show “Managed code” only, and then choose IIS process (w3wp.exe) from the list.


After the process is attached the solution will run in debug-mode by itself. Create a break-point in the library code, and then run the program that trigger this library, you will see process will stop at the designated break-point.
Reference:
http://cedricboudoya.wordpress.com/2008/11/04/how-to-debug-a-wcf-service/